Most manufacturer Salesforce orgs run on hindsight. Reorder triggers fire when stock has already dipped below safety. Warehouse layout updates during the annual physical count. Production planning lives in spreadsheets out of sync by Wednesday. The system reacts to what has already happened - not what's about to.
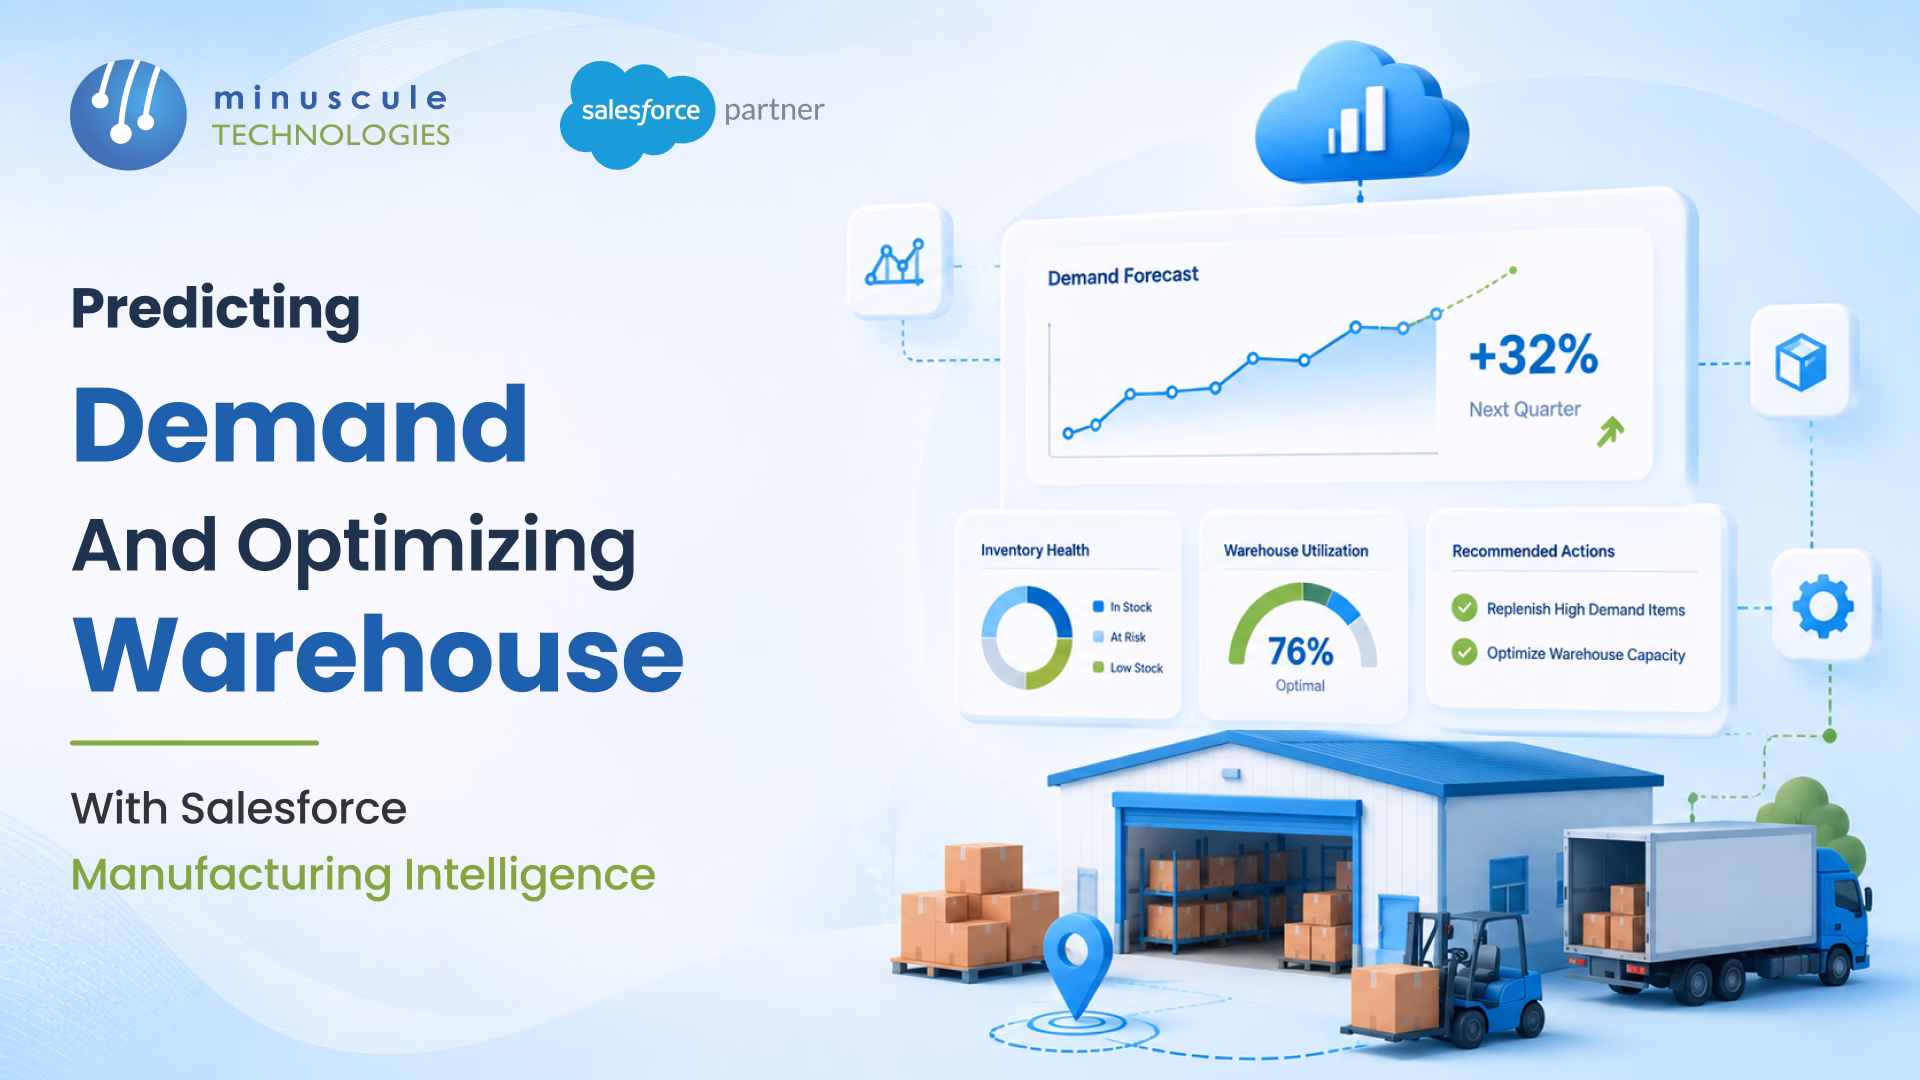
This isn't a problem. It's an intelligence problem. Salesforce Manufacturing Intelligence runs on a loop: Demand Forecasting reads the last 30 days of orders, inventory, and production config to predict demand; the system auto-creates Production Orders before Stock hits Reorder Point; Warehouse Optimization uses dynamic bin structure, product-to-bin mapping, and a Warehouse Heatmap to keep physical layout matched to actual product movement. Skip either side and your operation run one quarter behind reality.
The fix is a Manufacturing Intelligence architecture that uses Salesforce as the predictive layer - not just the transactional layer - so demand surprises and warehouse chaos stop costing the same money every quarter.
Five forces keep manufacturer Salesforce orgs in hindsight mode:
Each gap quietly costs a margin. Combined, they explain why supply chain meetings feel like an apology tour every quarter.
The source pattern reads three signals into the Demand Forecasting engine. The result isn't a quarterly Excel - it's a live, system-driven prediction.
Recent Activated Order volume by product, segment, and Territory. This is the velocity signal - what's moving, not what we hoped would move.
Available, Reserved, and In-hand across every Storage Warehouse. The inventory snapshot is the starting position the forecast runs against.
Capacity, Batch size, Cycle time, Lead time, Safety stock, and Reorder point from the inventory record. These constrain what the forecast can actually trigger.
System continuously monitors forecasted demand, inventory levels, and production constraints. When projected inventory is expected to fall below the Reorder Point within the Lead Time window, the system automatically creates a Production Order- helping manufacturers stay ahead of demand and avoid stock shortages.
Optimize warehouse space, improve picking efficiency, and increase storage utilization with an intelligent warehouse structure that adapts to changing inventory movement patterns. The solution combines dynamic storage locations, smart product placement, and visual warehouse insights to improve operational performance.
Bins aren't fixed shelves - they're recorded in Salesforce with a defined capacity, location, and product compatibility. The bin can be reassigned as product mix changes without renaming physical infrastructure.
Each product is mapped to the bin that fits its velocity, dimensions, and pick requirements. Fast movers land near the dispatch dock; slow movers go to the back; large items go bins with the right capacity profile.
A visual layer over the warehouse layout that shows pick activity, fill rate, and slot utilization. The Heatmap surfaces hot zones (overworked) and dead zones (under-used) so the layout can be rebalanced.
The intelligence layer isn't two disconnected features. The source pattern wires them together, so each side improves the other.
When Demand Forecasting projects a velocity shift - a product line moving from medium to fast - Warehouse Optimization rebalances bins to move that product closer to dispatch. The forecast doesn't sit in a report; it triggers physical layout change.
Pick activity, fill rate, and bin-level visibility from the Heatmap feed back into the forecast model. Products that move faster than the forecast predicted get their velocity inputs adjusted; products that move slower trigger Safety stock review.
Salesforce Manufacturing Cloud holds Inventory, Production config, and Warehouse records in one platform. The forecast and the layout read from the same source of truth - no cross-system reconciliation, no batch sync.
Five validation rules protect the intelligence layer from bad inputs.
Validate that the forecast horizon matches the longest Lead time across active products. A forecast shorter than Lead time can't trigger production in time to matter.
Block forecast-triggered Production Orders that aren't linked to a specific product, warehouse, and Reorder Point event. Stops orphaned production from running.
Block product-to-bin reassignment if the target bin's Capacity tracking is full. The system enforces physical reality, not theoretical optimization.
Block the Heatmap from displaying activity older than seven days. Stale data drives bad reassignment decisions.
Capture forecast versus actual variance every cycle. Patterns of over- or under-forecast trigger model recalibration - the loop closes.
Salesforce Demand Forecasting reads three inputs: the last 30 days of Activated Orders by product and Territory, current Available plus Reserved inventory levels, and the product's production configuration (Capacity, Batch size, Cycle time, Lead time, Safety stock, Reorder point). When projected demand inside the Lead time window pushes Available below Reorder Point, the system auto-creates a Production Order at the appropriate Storage Warehouse.
Safety stock is the minimum buffer of units a warehouse should hold to absorb demand variability without stocking out. Reorder point is the trigger threshold - the level at which the system fires an automatic Production Order. Safety stock is what you keep; Reorder point is when you act. The two are tuned together for each product.
The Warehouse Heatmap visualizes pick activity, fill rate, and slot utilization across every bin in the warehouse. Hot zones identify overworked areas where pickers fight for access; dead zones identify under-used capacity. Operations use the Heatmap to rebalance product-to-bin mapping - moving fast movers closer to dispatch and freeing dead zones for new product lines.
Technically yes, operationally no. Demand Forecasting without Warehouse Optimization produces accurate predictions that hit warehouses with the wrong layout - slow picks negate the timing advantage. Warehouse Optimization without Demand Forecasting produces an efficient layout for yesterday's product mix. Intelligence comes from running them together as one loop.
The quarterly apology tour in the opening scene isn't an outlier. Across manufacturing, the gap between hindsight and prediction shows up as late reorder triggers, static warehouse layouts, and supply chain meetings that start with what already went wrong. The architecture to close it isn't complicated. It just has to read three signals and act.
The Salesforce Manufacturing Cloud Starter is the product Minuscule built for manufacturers who don't want their next supply chain meeting to be a postmortem. It covers Demand Forecasting reading orders + inventory + production config, auto-Production Order creation before Reorder Point, dynamic bin structure with product-to-bin mapping, and the Warehouse Heatmap that rebalances layout to actual movement - engineered into one production-ready Manufacturing Intelligence platform. Manufacturers running it lead to supply chain conversations instead of explaining them.
Connect with our enterprise architecture team and we'll walk through the Manufacturing Cloud Starter and the forecasting architecture for your operations.
You've seen what's possible. Now, let's make it happen for your business. Whether you need an end-to-end Salesforce solution, a complex integration, or ongoing managed services, our team is ready to deliver.
Schedule a Free Strategic Call


