
May 30, 2026
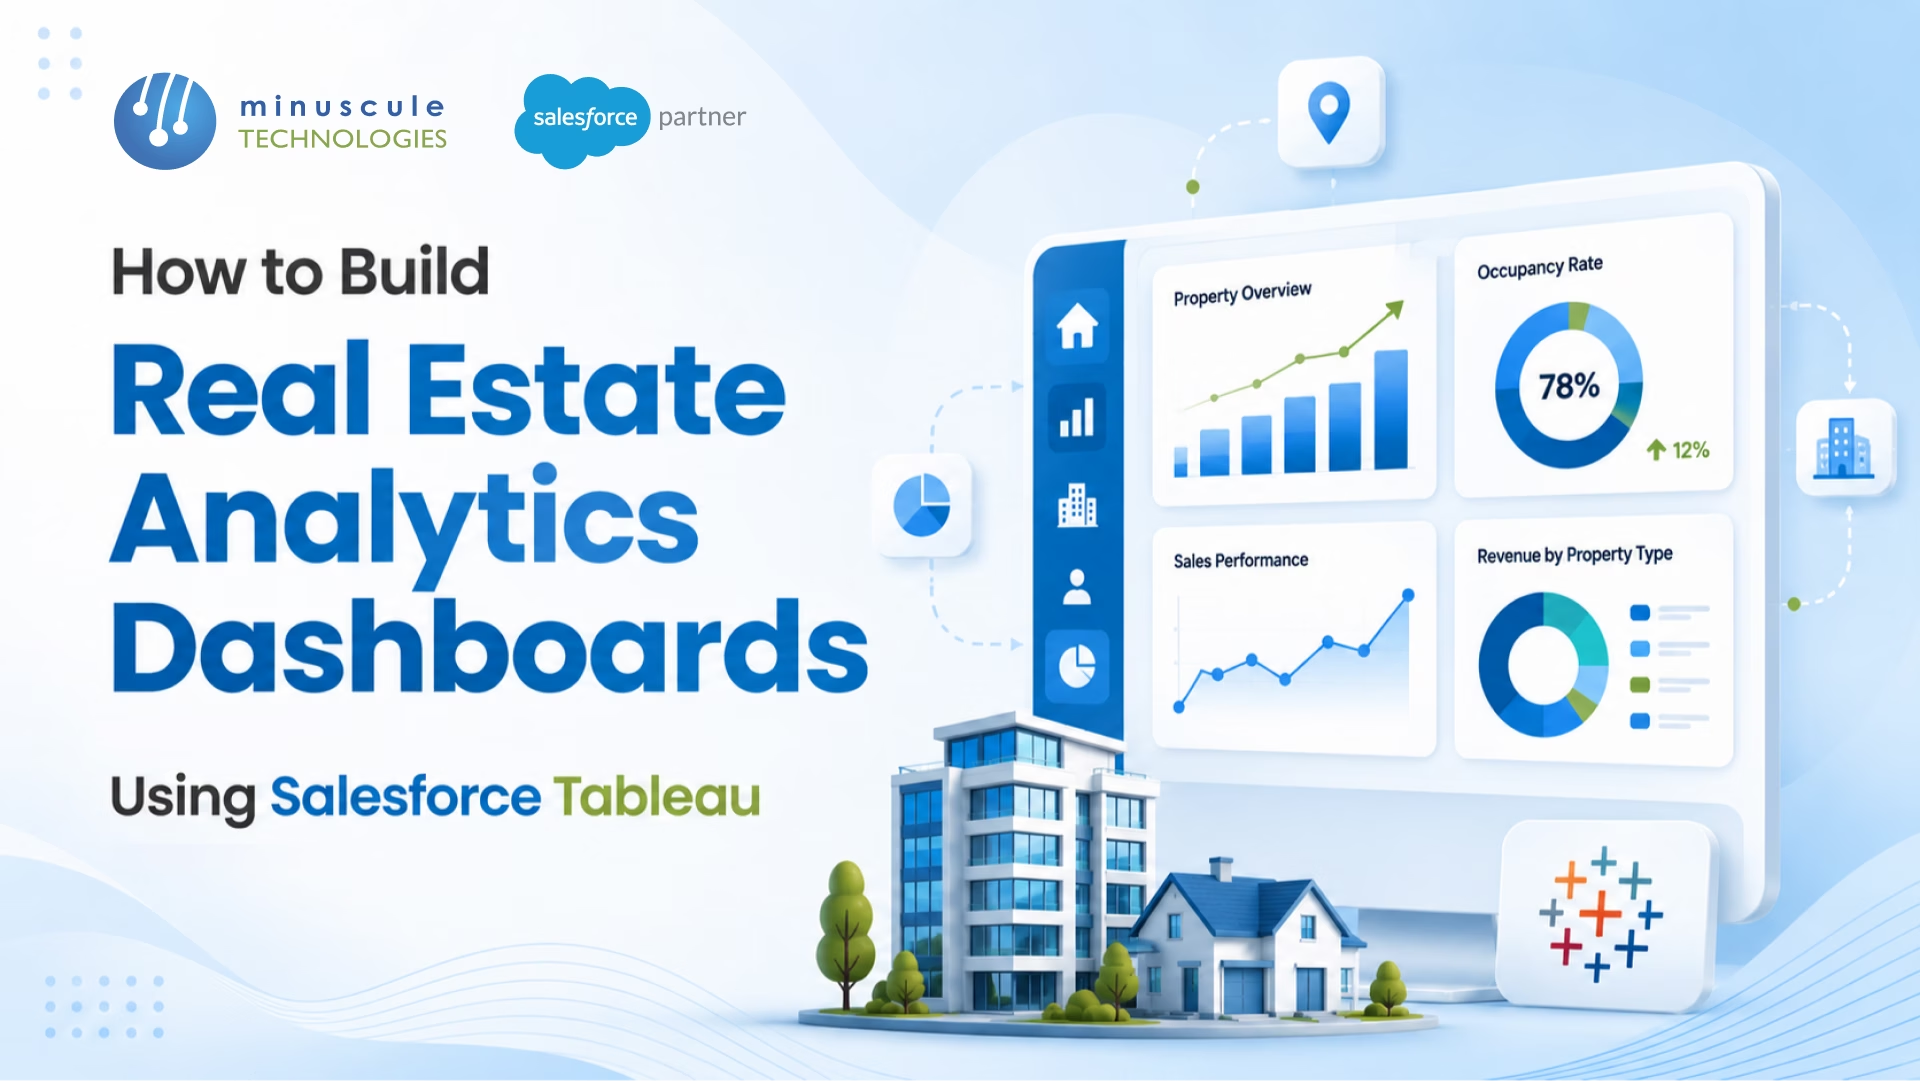
A real estate analytics dashboard built in Salesforce Tableau is a single, live view that ties property, lease, financial, and CRM data into charts a portfolio manager can act on. You pull data from Salesforce, Yardi or MRI, and finance systems, model it in Tableau, then surface it inside the Salesforce UI, so leasing, asset, and investment teams work off the same numbers.
If you've ever waited three days for a portfolio report or watched two teams argue over occupancy figures, you already know why this matters. This guide walks you through the build, end to end:
By the end, you'll have a clear plan to ship a working dashboard in weeks, not quarters.
A real estate analytics dashboard in Salesforce Tableau is an interactive workbook that combines property, leasing, financial, and CRM data and displays it as charts, KPIs, and tables inside Tableau Cloud or embedded directly into a Salesforce record page.
In plain terms, it's a one-stop view where:
Tableau is the Salesforce-owned visualization platform (Salesforce acquired Tableau in 2019). Since the launch of Tableau Cloud, Tableau Pulse, and the recent Tableau Next direction, the product line has tightened its integration with Salesforce, so a property record can show a live dashboard right next to the property's CRM data.
The dashboard isn't a static report. It refreshes a schedule, supports drilldowns, and - increasingly - answers natural-language questions through Tableau Pulse and Agentforce.
Real estate runs on five or six different systems. Yardi or MRI handles property accounting. Salesforce handles tenant relationships and the deal pipeline. ERP holds the GL, but Excel holds whatever didn't fit anywhere else. Add brokerage CRMs, asset management platforms, and capital markets tools, and the data is everywhere.
That fragmentation is a real problem. When the CFO asks, "what's our true NOI by property type?" and three teams pull three different numbers; the issue isn't analysis - it's the data pipeline.
Salesforce Tableau fixes this for a few reasons:
A common pattern: a global real estate firm we work with moved from a stack of Excel pivots and SSRS reports to Tableau Cloud connected to Salesforce, Yardi, and SAP. Portfolio reporting that used to take five business days now refreshes hourly. The CFO no longer asks, "is the data, right?" only "what should we do about it?"
If you'd like to see how this is done in production, our Salesforce real estate solutions page covers the integration patterns we use most often.
This is the question that trips up every team starting a new dashboard project. Salesforce has two analytics products with overlapping use cases, and the naming hasn't helped.
| Capability | Salesforce Tableau (Tableau Cloud / Server) | CRM Analytics (formerly Tableau CRM / Einstein Analytics) |
|---|---|---|
| Primary use | Enterprise BI across all data sources | Salesforce-first analytics |
| Data sources | 100+ connectors (SQL, Snowflake, Big Query, REST, files) | Salesforce objects, Snowflake, AWS, Azure (more limited) |
| Visualization depth | Very deep, drag-and-drop authoring | Strong but more templated |
| Embedded in Salesforce | Yes, via Tableau Viz LWC | Yes, deeply native |
| Licensing | Per-user Creator/Explorer/Viewer | Per-user CRM Analytics license |
| Best for | Real estate portfolios mixing CRM + Yardi/MRI + warehouse | Sales/service analytics, predictions with Einstein Discovery |
For real estate, Salesforce Tableau is usually the right choice because you're pulling from property management systems and warehouses that live outside Salesforce. CRM Analytics shines when your data is mostly already in Salesforce. Here is how to integrate Einstein Analytics with Salesforce CRM step by step.
Salesforce has signaled a unified direction with Tableau Next, which over time will bring the two products closer. For now, treat them separately, and pick based on where the data actually lives.
For a deeper architectural look, the Salesforce Tableau product blog covers the latest roadmap moves.
After delivering Salesforce-Tableau projects across multifamily, commercial, and industrial real estate, we've found dashboards that last are built on four clear layers. Skip a layer and you'll end up rebuilding the dashboard within a year.
Layer 1 - Source Systems. Your transactional truth. Salesforce holds tenant, lease, and pipeline data. Yardi or MRI holds property accounting. Your ERP holds the GL. Brokerage tools hold capital markets activity. Don't try to centralize the source-of-truth - connect to it.
Layer 2 - Data Integration & Warehouse. A landing zone for the data. Most teams use Snowflake, BigQuery, or Salesforce Data Cloud here. ETL or reverse-ETL tools (MuleSoft, Fivetran, Informatica) keep it fresh.
Layer 3 - Modeling in Tableau. This is where Tableau-published data sources, calculated fields, and LOD expressions encode the real estate logic - NOI, NER, occupancy adjustments, tenant churn formulas. Done right, every dashboard reads from the same modeled source.
Layer 4 - Consumption. Tableau Cloud workbooks, Salesforce-embedded views, Tableau Pulse digests, and Agentforce-powered queries. This is where the business actually uses the data.
The mistake most real estate firms make is jumping straight to Layer 4 - building dashboards on raw extracts - and ending up with twenty workbooks that all calculate NOI slightly differently. Build the stack in order, and you'll have one definition of NOI that the whole portfolio uses.
You don't need fifty metrics. You need ten that the team can act on. Here's the short list that covers leasing, finance, and asset management:
A dashboard with these ten KPIs, segmented by property and portfolio, covers about 80% of what an asset management team needs to monitor weekly.
If you're modernizing the data pipeline behind these KPIs, our team's work on data migration and harmonization for real estate clients is a good reference point - most failed dashboard projects fail at the data layer, not the visualization layer.
Here's the actual build flow. You can do this with Tableau Cloud or Tableau Server; the steps are the same.
Before you open Tableau, list every data source your KPIs depend on. For a typical real estate firm, the list looks like:
Write down the granularity of each source. If Yardi reports at the unit-day level and Salesforce reports at the deal-month level, that mismatch needs to be handled early.
In Tableau, go to Data → New Data Source. For Salesforce, use the native Salesforce connector and authenticate with OAuth - Tableau handles refreshing tokens. For Yardi, MRI, or RealPage, the cleanest approach is to land the data in a warehouse (Snowflake/BigQuery) first and connect Tableau to the warehouse. Pointing Tableau directly at a property management system tends to create performance and security headaches. Learn more about the challenges of integrating Salesforce with real estate ERPs.
For real-time needs, MuleSoft or a Salesforce-native integration can sync Yardi data into Salesforce Custom Objects, and Tableau reads from there.
Use Tableau Prep Builder to clean and shape data before it hits the dashboard:
This is where your NOI, NER, and occupancy logic lives - as calculated fields in the published data source, not buried in individual workbooks.
A good real estate dashboard layout follows the F-pattern most user's scan:
Build it on a 12-column grid. Avoid the urge to fit twenty charts onto one screen -give each chart room to breathe.
For each KPI, pick the chart that best fits its decision use:
Use parameters and filter actions so a click on a property drill into property-level detail. Keep tooltips rich - they're prime real estate (literally) for context.
Publish Tableau Cloud. Set the refresh schedule based on how often the underlying data changes- hourly for leasing pipelines, daily for financials, weekly for market comps.
To embed inside Salesforce:
Governance matters more than people expect. Tag every workbook, document data lineage in your data catalog, and review usage monthly. Workbooks no one opens should be archived - clutter erodes trust in the dashboard you do want them to use.
If your team needs help with the Salesforce embedding and security model, our DevOps and managed services team handles the LWC and permission set work as part of the rollout.
Use this as a starter blueprint when you sit down to wireframe your dashboard:
| KPI | Recommended Tableau Chart | Filters / Drill-down |
|---|---|---|
| NOI | KPI tile + line chart trend | Property, region, property type, month |
| NER | Bar chart by lease, line chart over time | Lease, tenant, signing date |
| Occupancy Rate | Heat map across portfolio + KPI tile | Property, region, asset class |
| Lease Expiration Schedule | Gantt chart or stacked bar by month | Property, lease type, tenant |
| Tenant Churn Rate | Line chart with cohort overlay | Tenant segment, property type |
| Cap Rate | Scatter plot (NOI vs. asset value) | Property, region |
| Days on Market | Box plot by property type | Property, unit type, region |
| Lease Pipeline Velocity | Funnel chart + waterfall | Stage, leasing agent, property |
| Capital Deployment | Stacked bar (committed/funded/deployed) | Fund, vintage, asset class |
| Operating Expense Ratio | Bullet chart vs. budget | Property, expense category |
A working dashboard built around this blueprint typically takes two to four weeks to deliver, depending on data readiness and the integration of work in Step 2.
Most real estate analytics dashboards fail to share a few patterns. Watch for these:
A practical tip: do a "data dictionary" pass before you go live. Each KPI gets a one-paragraph definition, a list of source fields, and the name of the person who owns it. This single artifact prevents 80% of the "why is the number wrong?" Conversations. For wider platform issues, see these Salesforce real estate pitfalls and fixes.
Two recent shifts are worth planning for, even if you're just starting your first dashboard.
Tableau Pulse delivers personalized metric digest to users - by email, Slack, or inside Salesforce. Instead of an asset manager opening a dashboard every morning, Pulse pushes the changes in their KPIs ("occupancy at Property X dropped 4% this week") with a short explainer. For real estate teams scattered across regions, this cuts dashboard-opening friction.
Agentforce - Salesforce's agentic AI layer - lets users ask questions in natural language and get answers grounded in Tableau data sources. A leasing manager asks, "which leases in my region expire in Q3 and have high renewal risk?" and gets a filtered list pulled from the same modeled data the dashboards use.
Both depend on the analytics stack being clean. If your KPIs aren't standardized in a published data source, Agentforce will give different answers to the same question depending on phrasing. The 4-layer stack we covered earlier is what makes these AI features actually useful.
For the latest on Tableau's AI direction, the Salesforce Ben analytics coverage is worth following.
No. Salesforce Tableau (the Tableau Cloud and Tableau Server product) is the broader BI platform Salesforce acquired in 2019. Tableau CRM, formerly Einstein Analytics and now called CRM Analytics, is a separate Salesforce-native analytics product. They overlap, but Tableau handles enterprise multi-source BI better, while CRM Analytics is tuned for Salesforce-resident data and Einstein predictions.
Technically yes, but the cleaner pattern is to pipe Yardi or MRI data into a warehouse (Snowflake, BigQuery, or Salesforce Data Cloud) and have Tableau read from there. Direct connections create performance bottlenecks and security exposure. For real-time scenarios, sync the Yardi data into Salesforce Custom Objects via MuleSoft and let Tableau read those.
A focused dashboard covering the top ten KPIs typically takes two to four weeks once data sources are accessible. Most of the time is data integration and modeling. The Tableau visualization itself usually takes three to five days for an experienced developer.
Tableau Cloud licensing is per user, with Creator, Explorer, and Viewer tiers. List pricing starts at around $15/user/month for Viewer and climbs for Creator licenses. Pricing changes regularly, so check the Salesforce Tableau pricing page for current numbers. For a mid-sized real estate firm, the all-in cost is usually a fraction of what an equivalent custom-built reporting tool would cost to develop and maintain.
Yes. Use the Tableau Viz Lightning Web Component, which Salesforce ships out of the box. Drop it onto a Property, Account, or Opportunity record page, pass the record ID as a filter, and the viz shows only that record data. Pair it with row-level security in Tableau, so users only see what they're authorized to see.
For a single-property dashboard, no - direct Salesforce + a couple of extracts works fine. For a portfolio dashboard pulling from Salesforce, a property management system, and finance data, a warehouse pays for itself fast. Snowflake, BigQuery, and Salesforce Data Cloud are common choices.
A dashboard waits for users to open it. Tableau Pulse pushes metric changes to users - by email, Slack, or in-app - with a short explainer. For asset managers who need to know when occupancy drops or NOI shifts, Pulse beats opening a dashboard every morning.
Minuscule Technologies is a trusted Salesforce engineering partner with 160+ certified Salesforce expert and deep delivery experience across real estate, including Yardi-Salesforce integrations, NOI and NER automation, and capital deployment pipelines. If you're planning a Salesforce Tableau rollout - or rescuing one that stalled at the data layer - talk to our team about a focused assessment that gets your first dashboard live in weeks. We've done this for global real estate firms managing portfolios across multifamily, commercial, and industrial assets, and we know where the integration of landmines hides.
For more on our approach, see how Minuscule helps modernize legacy Salesforce orgs and connect them to your property management stack.
You've seen what's possible. Now, let's make it happen for your business. Whether you need an end-to-end Salesforce solution, a complex integration, or ongoing managed services, our team is ready to deliver.

Schedule a Free Strategic Call


Plot No. 4, Sridevi Amman Street, Perumal Nagar Extension, Old Pallavaram, Chennai, Tamil Nadu 600117, India.
