We are at Dreamforce 2026, Industry Pavilion at San Francisco


March 28, 2025
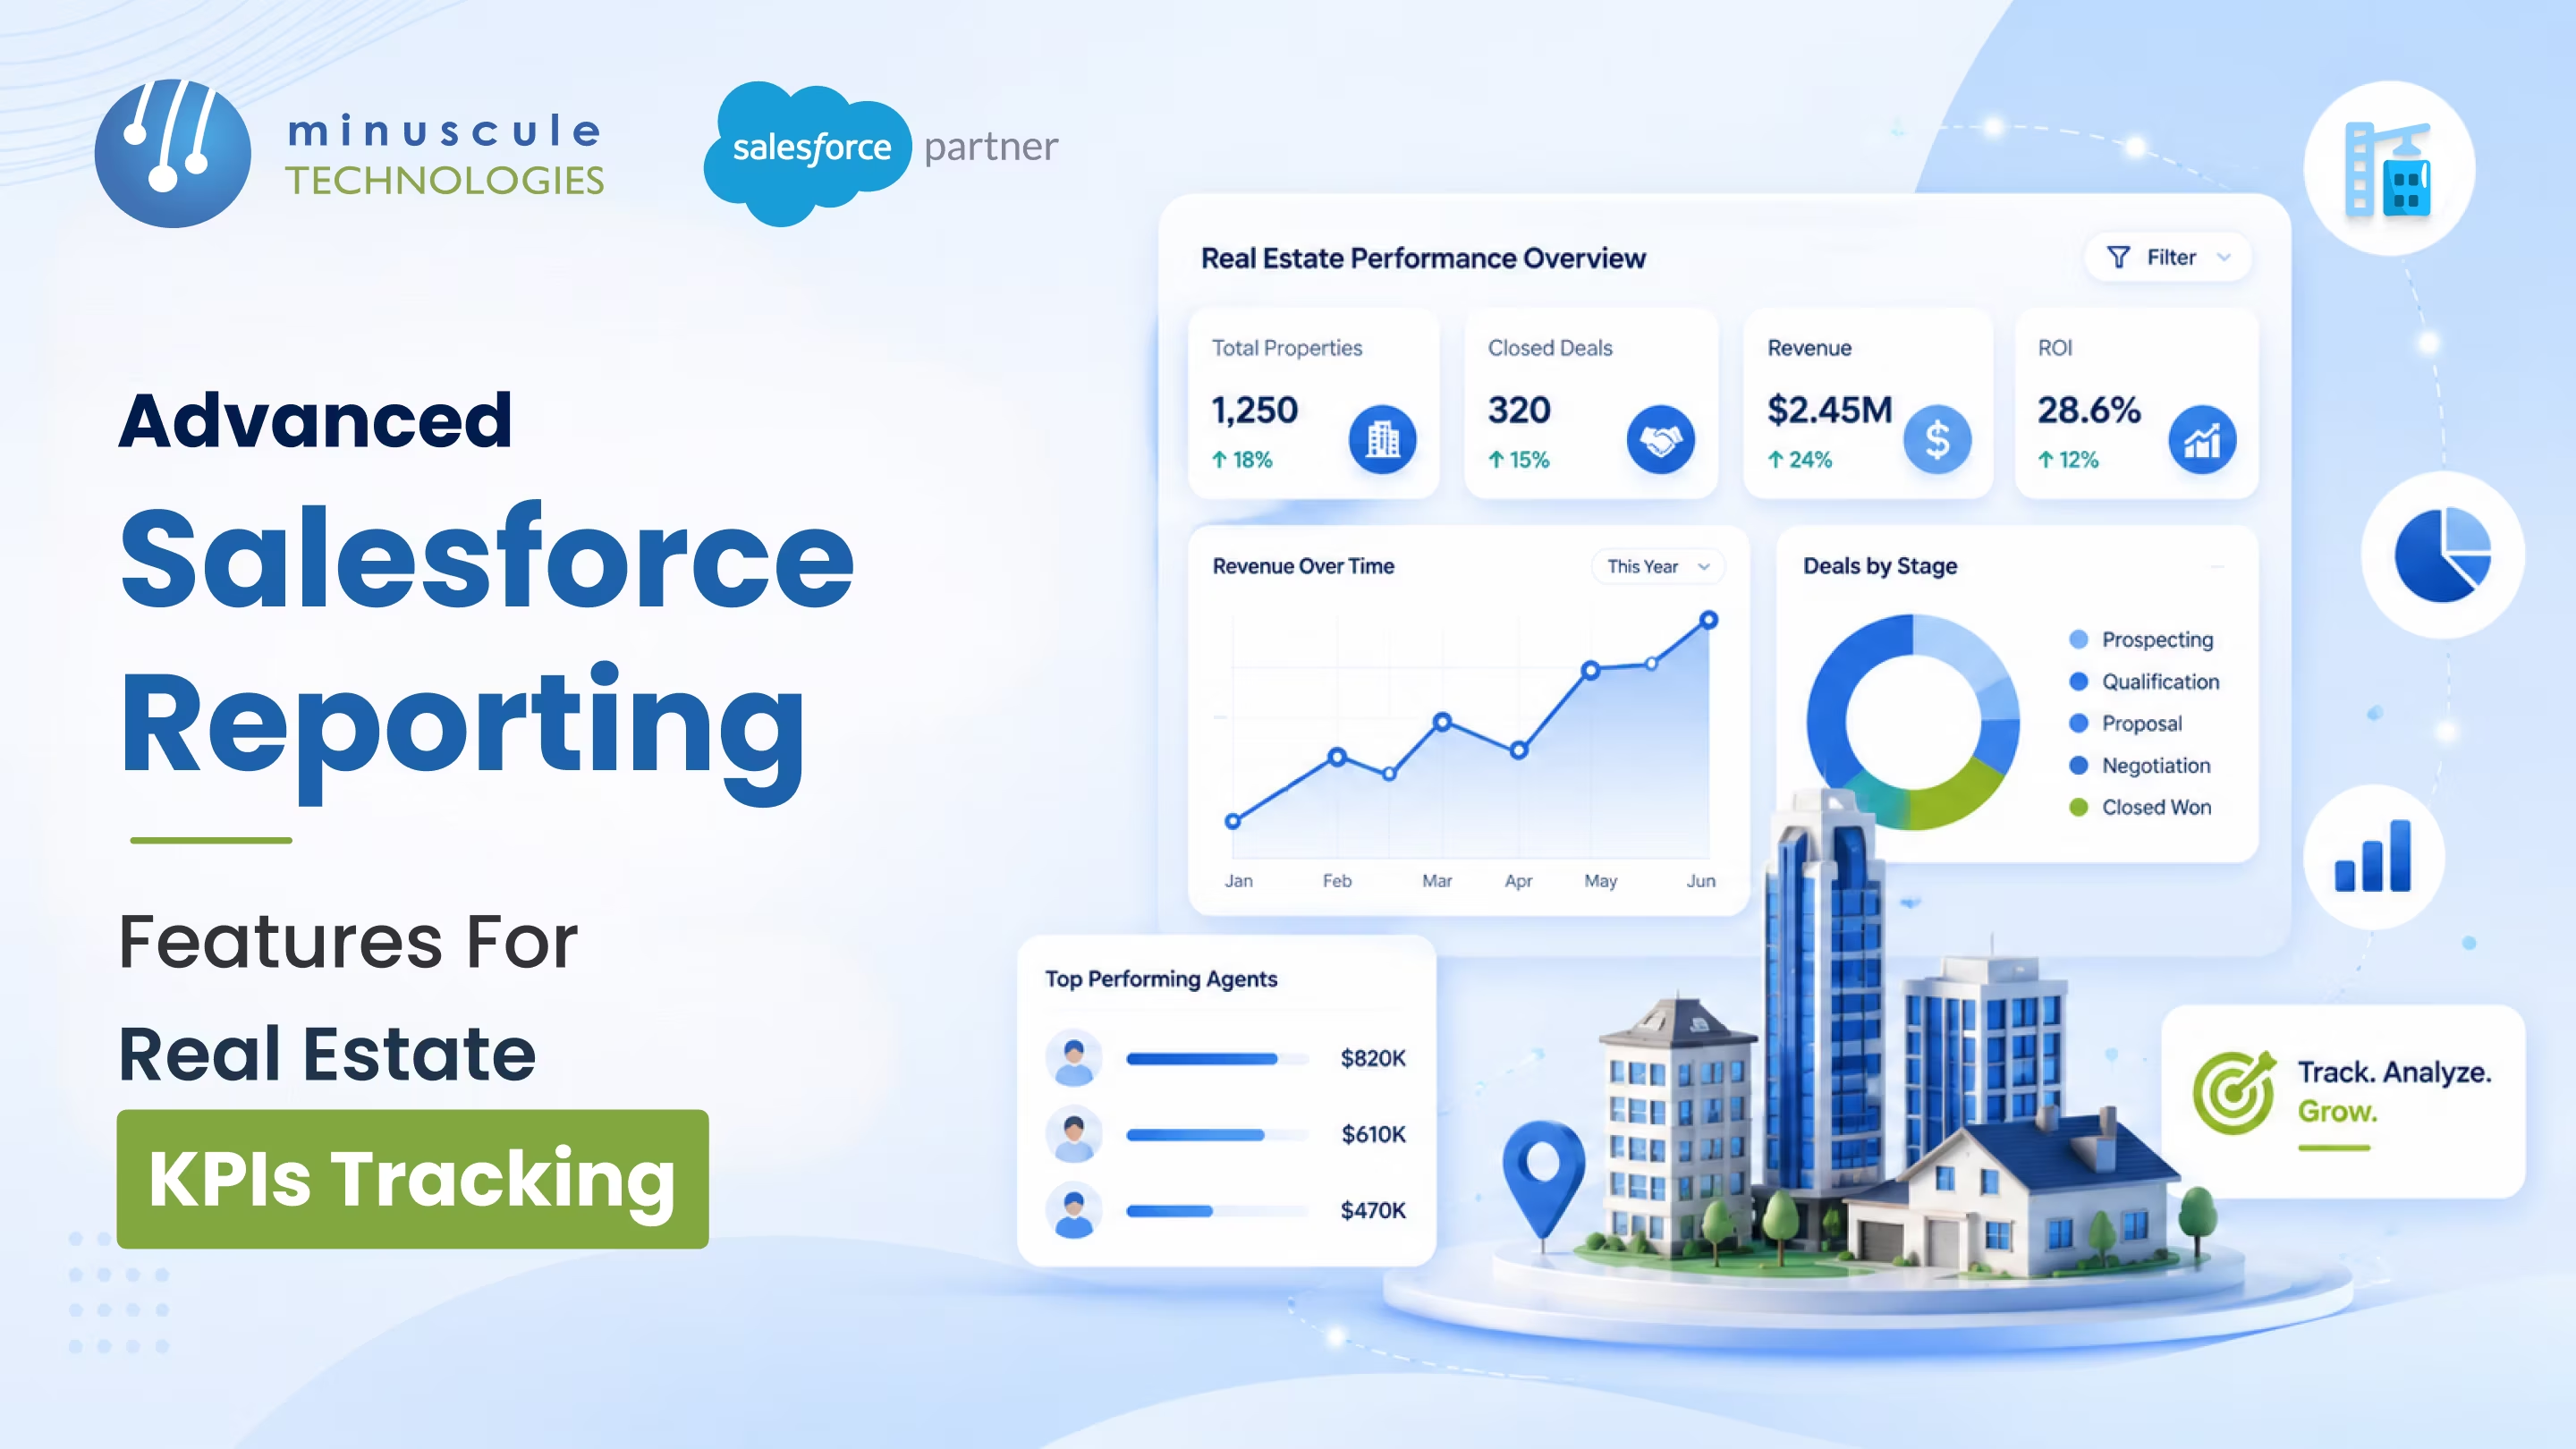
In real estate, the firm that reads its numbers first wins the deal. Salesforce reporting turns your leads, listings, and closings into clear numbers you can act on, instead of a pile of records no one has time to read. This guide covers the KPIs worth tracking, the reporting features that surface them, and how to turn all of it into a decision.
Most agencies sit on plenty of data and use almost none of it. Deals close, leads go cold, and no one sees the pattern until a quarter is already lost. The information was there the whole time, buried in records nobody reported on. Good reporting fixes that, turning raw records into a live read on the business you can check any morning.
By the end, you will know the five KPIs to watch and the Salesforce features that report on them. You will see how dashboards pull it all onto one screen, and where a partner speeds the setup up. Read on for a plain-English guide you can put to work this quarter.
Before you build reports, know what to measure. A handful of KPIs tell most of the story for a real estate firm. The table sets them out, with what each one tells you and why it matters.
| KPI | What it tells you | Why it matters |
|---|---|---|
| Lead conversion rate | Share of leads that become deals | Shows marketing and follow-up quality |
| Sales revenue | Income by source and period | The core measure of growth |
| Time on market | How long a listing sits | Signals pricing and demand |
| Average deal size | Typical value per closed deal | Guides where to focus effort |
| Closing ratio | Deals won versus opportunities | Reveals sales-funnel health |
Start with two or three of these, not all five at once. Pick the ones tied to your biggest goal this quarter, prove the report, then add more. Community guides like these Salesforce Geek reporting walkthroughs help if reports are new to your team.
Each KPI points to an action. A low conversion rate means the follow-up needs work. A long time on market means the price or the marketing is off. The value is not the number itself, but the decision it drives.
Standard reports get you started, but real estate needs more. The table lists the features that do the heavy lifting, with a real estate use for each.
| Feature | What it does | Real estate use |
|---|---|---|
| Custom report types | Combine fields from related objects | Link leads, listings, and deals |
| Summary and row-level formulas | Calculate inside the report | Commission, price per square foot |
| Cross filters | Filter by a related object | Find unassigned leads or stale listings |
| Historical trend reporting | Compare a field across dates | Track pricing and demand over time |
| Joined reports | Merge report types in one view | Compare marketing spend to sales |
The sections below cover the ones that matter most for a property firm.
Standard reports rarely fit a real estate data model. Custom report types let you pull fields from related objects. A single report can then link a lead to a listing and a closed deal. That gives you the full path, not a slice.
Set these up once, and your team reports on the connections that matter, like which source produced the most closings. Developer notes like these SFDCPanther reporting guides show how to build them cleanly.
Formulas turn a report into a calculator. Summary formulas roll up totals, like commission by agent or region. Row-level formulas work on each record, so you can show profit margin or price per square foot per property.
That removes the spreadsheet step. The math lives in the report and updates as the data changes, so no one re-keys numbers by hand.
Cross filters find what is missing. They filter records by a related object, so you can surface leads with no agent, listings with no activity, or deals missing documents. These are the gaps that cost money.
Run an exception report each week, and problems surface before they grow. Admin tips like these SFDCStop reporting tips cover the common filters worth setting.
Real estate moves in cycles, so the past predicts the near future. Historical trend reporting compares a field across dates. You see how a listing price or pipeline value shifted over time.
Reporting snapshots go further, saving report results on a schedule for long-term analysis. Together they turn a single moment into a trend you can plan around.
Some questions need two reports at once. Joined reports place different report types side by side in one view, so you can compare marketing spend against closed sales, or performance across regions.
That connection is where insight lives. Seeing spend and results together tells you where the next dollar should go. Tutorials like these SFDC Fanboy report guides walk through the setup.
Reports answer one question at a time. A dashboard shows them all at once. For a real estate firm, that means pipeline, revenue, and time on market on one screen, refreshed live.
Build a dashboard per audience. A broker sees deal flow and closing ratio. A manager sees revenue and agent performance. Each person opens one screen and gets the numbers that shape their day. No one has to run a report.
Reports are only as good as the data behind them. Messy records and scattered systems produce numbers no one trusts. This is where a partner earns its keep, on the data model and the setup.
A good partner cleans your data first. Then they build the report types and dashboards, and connect the systems that feed them. Many firms keep property data in another tool. A Yardi and Salesforce integration brings it into one place to report on. You can also automate the math, as our guide on real estate KPI automation shows.
The payoff is trust in the numbers. When the data is clean and the reports are built right, your team acts on them instead of second-guessing. A short Salesforce consulting session is a good place to start.
Start with lead conversion rate, sales revenue, time on market, average deal size, and closing ratio. Together they show marketing quality, growth, pricing, and funnel health. Pick the two or three tied to your biggest goal first.
Custom report types let you build reports from fields across related objects, beyond the standard set. For real estate, that means linking leads, listings, and deals in one report. You see the full path, from inquiry to close.
Both. Reports answer one question in detail, while a dashboard shows several at once, live. A dashboard per role gives brokers and managers the numbers that shape their day without running each report.
Bring it into Salesforce first. An integration syncs property or accounting data from a tool like Yardi, so you can report on it alongside your CRM records. Clean, connected data is what makes reports trustworthy.
Not for a basic report. A partner helps most when data is messy or spread across systems, or when you need custom report types and dashboards. The value is in clean data and reports your team trusts.
Salesforce reporting turns a pile of records into a clear read on your firm. Track the right KPIs, use custom report types and formulas to shape the data, and pull it together on dashboards each team can open at a glance. That is how a real estate business runs on facts, not hunches, and spots a problem while there is still time to fix it.
Where Minuscule Technologies helps is the engineering behind those numbers. As a Salesforce and Yardi partner with deep roots in US real estate, our teams clean your data so the reports can be trusted. We build the report types and dashboards, connect the systems that feed them, and document it all so your team can run it. Our accelerators shorten that build.
Want reports your team actually acts on? Book a free strategic call, and we will look at the KPIs that matter most for your firm, map the reports and dashboards to track them, and hand you a clear plan to get there.
You've seen what's possible. Now, let's make it happen for your business. Whether you need an end-to-end Salesforce solution, a complex integration, or ongoing managed services, our team is ready to deliver.

Schedule a Free Strategic Call


